The LLM benchmark table is getting rather long and cumbersome to take in at a glance. On a whim, I had Claude throw together a scatter plot on cost/accuracy axes.
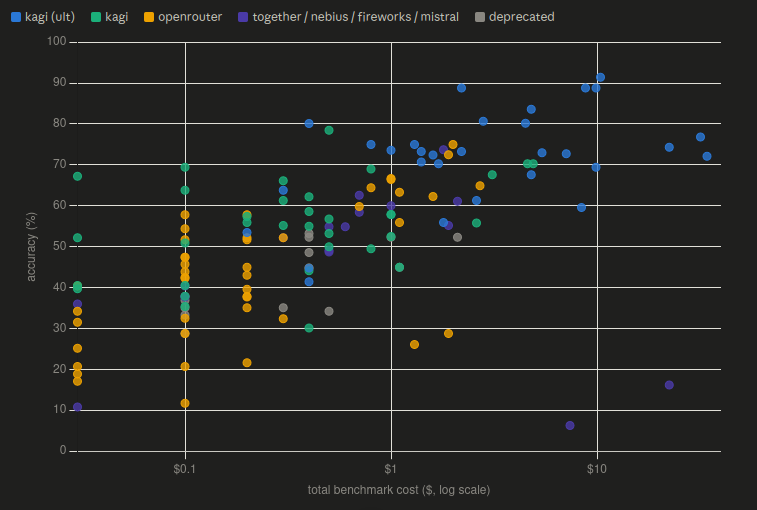
Thought I'd throw in a suggestion here for something like this, it was revealing to me to look at and see what bang you can get for you buck.
Here's my Claude thread, in case that's useful:
https://claude.ai/share/1ff32dcf-ace9-4d7d-8406-b5a6f13679b4
