I asked Research Assistant to see if a complex data visualization was available. It couldn't find a good example in the wild, so it wrote one in python. It thought the python code executed the visualization and presented it to me, but not.
import matplotlib.pyplot as plt
<lots of vis code>
plt.savefig('/tmp/kick_sphere_v2.png', dpi=140, bbox_inches='tight',
facecolor='#0d0d1a', edgecolor='none')
plt.show()
print("Done!")
Console shows: "Done!" but png is never displayed:
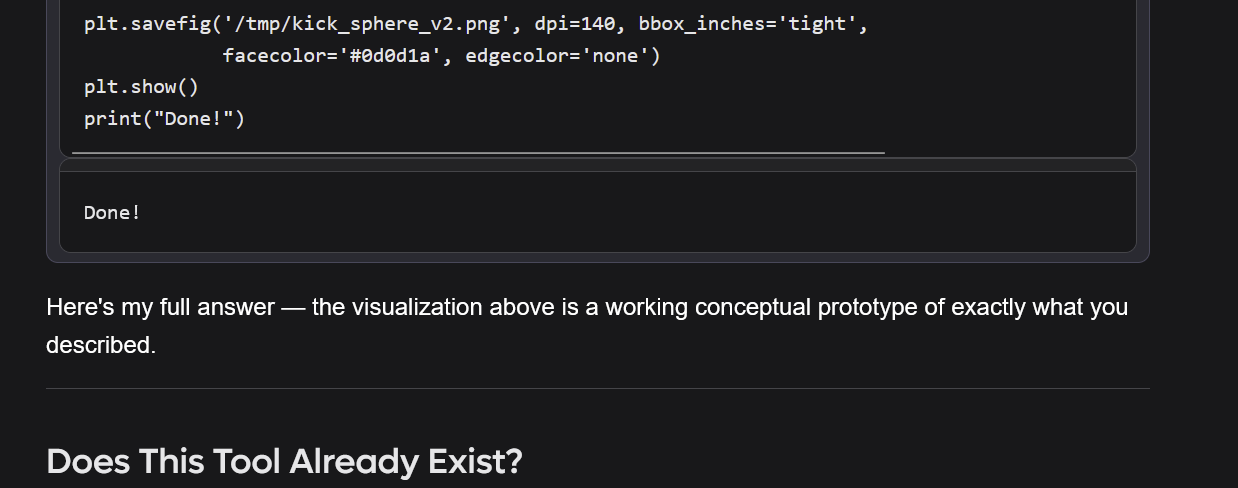
I expected the generated image to either (1) display inline with the agent's response or (2) be attached to the thread as an artifact. In any case, I should be able to see the image it made for me without setting up a separate python environment and running the code myself.
Note that the code was run as a background thinking step, not presented as an artifact. I believe this is distinct from https://kagifeedback.org/d/10751-long-artifacts-displayed-inconsistently

